- Posted on
- Data Analytics Club
- Data Analytics Club
A Road Map to Data Visualization and its Industry Use Cases
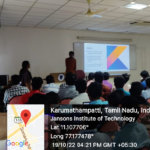
Visualization enables the presentation of data in an attractive and readily-usable format. It helps in identifying patterns and drawing focus to details that would be lost in conventional representations like spreadsheets. Data Visualization uncovers hidden insights and supports exploratory analysis and informed decision-making.To know more Data Analytics Club organised a webinar on A Road Map to Data Visualisation & It’s Industry Use for Artificial Intelligence and Data Science Students on 27-04-2021 from 4.00pm to 5.00pm in Lecture Hall 5 through online mode.Mr.P Ranjith, Analyst @IQVIA was invited as a guest speaker for the program. He gave striking information about data visualisation and how it has been applied in real world problems
The goal of this webinar was student has to gain knowledge on data visualisation and awareness on various skill sets required for a data analyst.
Number of Participants:63